Many people have tried to reduce the astronomical size of the national debt to something that Rush’s “low information voters” can understand. Many such attempts revolve around trying to equate our nation’s debt to household budgets and credit cards but this doesn’t really do the whole discussion justice.
I wish to advocate a different approach. Let’s embrace the largeness of the debt and explain it in a way that regular Americans can understand it. Three levels of debt that need to be illustrated are national, state, and local government.
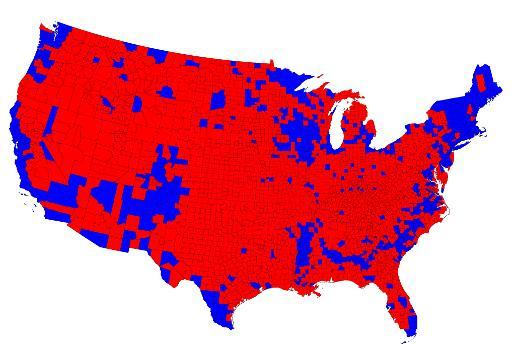
I would like to see the debt displayed similarly to this map of 2012 election results by county.
(shown above)
My idea is to display how much American real estate would need to be sold to the Chinese or whoever in order to pay down the debt. The map would need four colors, one color for each level of government debt and a fourth color to show what is leftover. If you really want to illustrate the point, you could do two maps, one current debt and the other all the unfunded obligations that government has made.
For dramatic effect, start the map on the western shores of the Mississippi River and let’s see if anything remains of “flyover country”. I think it would be an interesting exercise. Perhaps we could literally show that the government has mortgaged the future of our citizens in a way even “baby-boomers” could understand.
